RevLab Seismo V1: From Random Thought to Real Instrument
A few weeks ago, the “RevLab Seismo V1” did not exist. It was simply an idea, a random thought about building a tiny desktop “seismograph” to measure how much a 3D printer shakes a table or shelf while printing. The original concept sounded simple on paper: use a vibration sensor, connect it to a microcontroller...
5/25/20263 min read
RevLab Seismo V1: From Random Thought to Real Instrument
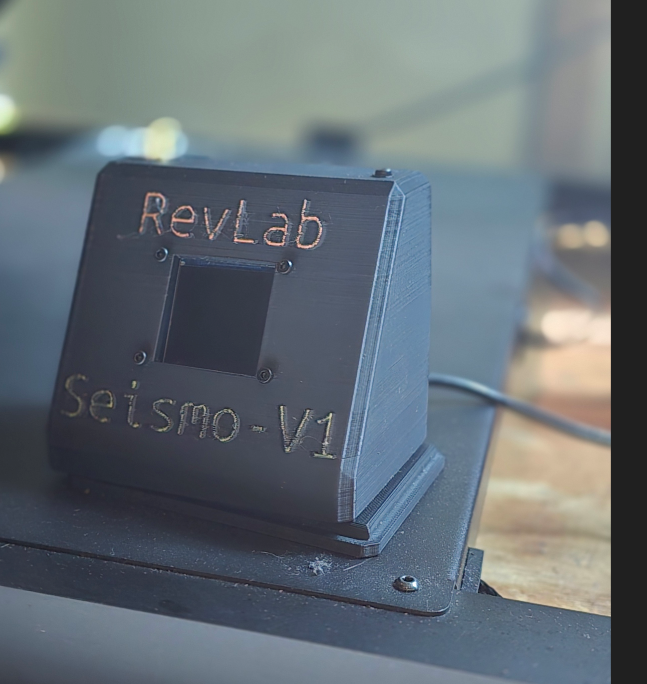
A few weeks ago, the “RevLab Seismo V1” did not exist. It was simply an idea, a random thought about building a tiny desktop “seismograph” to measure how much a 3D printer shakes a table or shelf while printing. The original concept sounded simple on paper: use a vibration sensor, connect it to a microcontroller, and display the results on a screen. But like many engineering projects, the deeper the idea was explored, the more interesting it became.
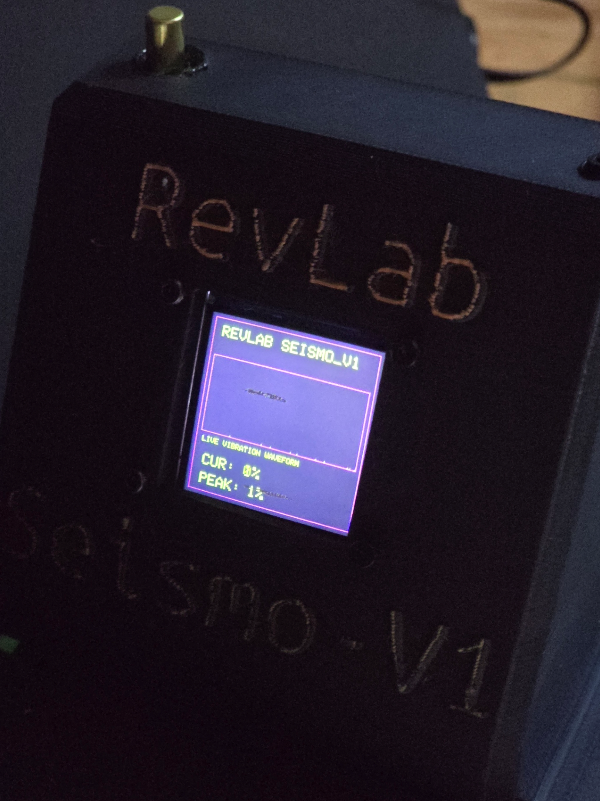
The project began with an ESP32 microcontroller, an MPU6050 accelerometer/gyro module, and a 1.3-inch ST7789 IPS display. The ESP32 became the brain of the system, responsible for communicating with both the sensor and the display simultaneously. The MPU6050 handled motion sensing over I2C, while the IPS display used SPI. Just getting both systems wired, powered, and communicating reliably together was the first major milestone. What started as a loose concept quickly became a functioning embedded system.
Once the display was operational, the project shifted into sensor integration. The MPU6050 could instantly feel movement, vibration, impacts, and even tiny environmental changes. However, the first readings revealed an important lesson: raw sensor data by itself is almost meaningless. Even when sitting perfectly still, the sensor constantly reported movement because it could detect gravity, electrical noise, and microscopic environmental vibrations. The device technically worked, but it had no understanding of what “normal” actually looked like.
That problem led to one of the most important parts of the project: calibration. During startup, the Seismo V1 now enters a calibration phase where it remains still for a few seconds and learns its resting state. The ESP32 averages these readings together to establish a baseline for calm conditions. From that point forward, the device no longer blindly displays raw acceleration numbers. Instead, it compares live movement against its baseline to determine how much vibration is actually occurring. That small change transformed the project from a simple sensor demo into a real monitoring system capable of interpreting environmental changes.
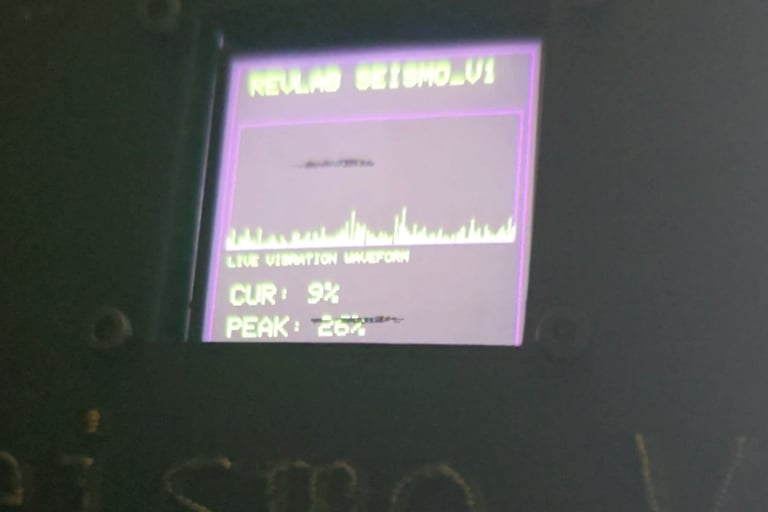
With calibration working, the next step was converting movement into something humans could quickly understand. The system began calculating a live vibration percentage and tracking peak vibration levels over time. The Seismo V1 could now physically feel movement from printers, tables, or impacts and immediately report back how intense the movement was. But the project became truly exciting once live waveform rendering was added to the display.
Instead of simply showing percentages, the Seismo V1 now draws a scrolling vibration graph across the IPS display in real time. Movement suddenly became visual. Sharp printer travel moves create spikes. Rhythmic motion creates repeating patterns. Impacts appear as violent jumps in the waveform. The system no longer just reports vibration; it allows the user to actually see machine behavior unfolding live on screen. That single addition transformed the device from a simple electronics project into something that genuinely feels like a tiny scientific instrument.
One of the most surprising discoveries during testing was how controlled modern printers actually are. A printer that visually appears aggressive may produce surprisingly low vibration readings because its motion system is carefully engineered to distribute and dampen forces smoothly. Even simple comparisons, like typing on a desk versus printer movement, revealed how chaotic and impact-heavy human interaction can be compared to the controlled acceleration of a machine. The project quickly evolved beyond “measuring shaking” to studying how energy moves through structures, tables, enclosures, and machines.
The most important part of the Seismo V1 project is not the hardware itself, but the transition it represents. The system crossed the line from “a few electronics modules connected together” into “a machine capable of sensing and interpreting the physical world.” The device now continuously monitors movement, processes sensor data, compares it with known conditions, and communicates meaningful feedback to the user in real time. That same basic principle underlies industrial sensors, robotic systems, automotive diagnostics, scientific instruments, and countless modern smart devices.
RevLab Seismo V1 may still be physically rough around the edges, but it is real. It exists. It powers on. It reacts to the world. And perhaps most importantly, it proves that an idea that existed only in imagination a few weeks ago can become a functioning instrument through experimentation, iteration, and persistence.