RevLab Seismo V1
A Working Project...
5/13/20264 min read
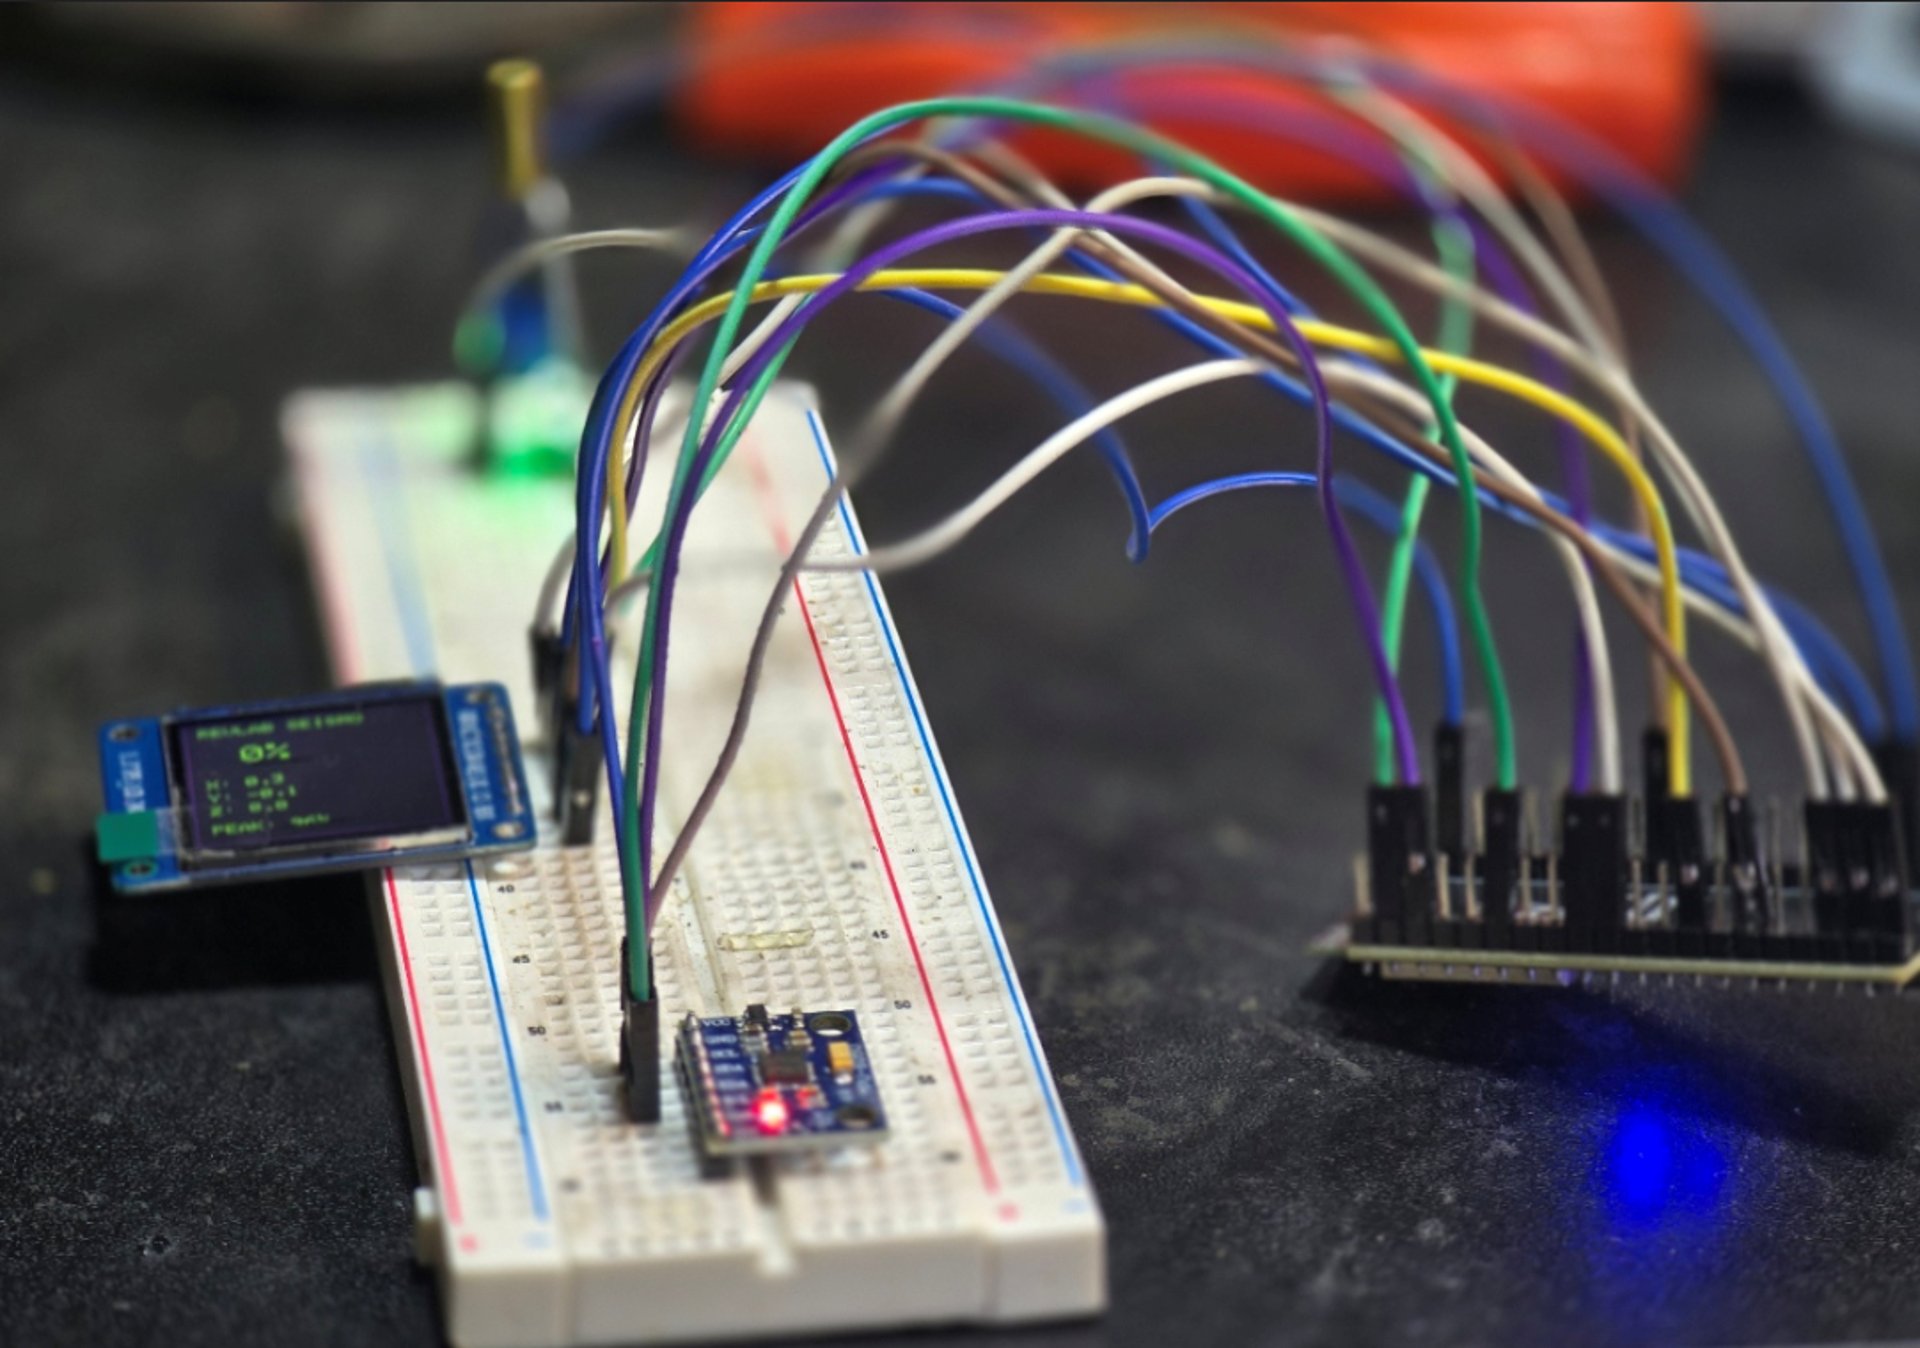
What I built... so far... Essentially is the first functional prototype of a compact embedded vibration-analysis instrument, a device designed to observe, interpret, and display real-world physical movement in real time. While the project started as a simple idea of “seeing how much a printer shakes the shelf,” it quickly moved into the realm of sensor integration, signal interpretation, hardware communication, and embedded interface design. The current state of the project, now called “RevLab Seismo V1,” is already far beyond a beginner electronics experiment. It is a functioning diagnostic tool built around an ESP32 microcontroller, a ST7789 IPS display, and an MPU6050 accelerometer/gyro module working together as a unified system.
At the center of the build is the ESP32, which acts as the “brain” of the device. The ESP32 is responsible for powering the system logic, communicating with sensors, processing data, and rendering information to the display. One of the more important aspects of the build is that two entirely different communication systems are operating simultaneously. The MPU6050 uses I2C communication, while the ST7789 display uses SPI communication. These are different hardware protocols, each with its own timing, pin requirements, and behaviors. Getting both operating systems to work together reliably is one of the first points at which the project becomes “real embedded systems work” rather than a simple plug-and-play gadget. The ESP32 continuously reads acceleration data from the MPU6050 over I2C while also updating the graphical interface over SPI at a rate that keeps live telemetry responsive.
The display itself became a major upgrade over the original OLED idea. Instead of a tiny monochrome screen, the project uses a 1.3-inch 240x240 IPS ST7789 display, which allows for full-color rendering and a much more instrument-like appearance. The result visually resembles a miniature scientific device rather than a hobbyist electronics project. The display currently renders a live interface containing vibration percentages, raw axis readings, and peak activity measurements. Even in this early stage, the interface establishes the system's visual identity. The black background, neon green text, and purple accents immediately give the device a “RevLab” aesthetic while also improving readability and reinforcing the idea that this is a monitoring instrument, not just a debug screen.
The actual sensing system is powered by the MPU6050. This sensor contains both an accelerometer and a gyroscope, though the current version primarily uses the accelerometer data. The MPU6050 measures movement along three axes: X, Y, and Z. Every tiny movement, vibration, tap, resonance, or shake causes measurable changes in acceleration values. However, one of the first important discoveries during development was that raw acceleration data alone is not enough to meaningfully measure vibration. Gravity itself constantly affects the readings, particularly on the Z-axis, so the sensor naturally reports approximately 9.8 m/s² even when sitting completely still. Without calibration, the system interprets normal gravity and tiny electronic noise fluctuations as vibration, which is why early tests incorrectly showed 18–19% vibration while idle.
To solve this, the project introduced a calibration phase. During startup, the system now enters a “CALIBRATING / KEEP STILL” state. During this phase, the ESP32 samples the sensor repeatedly while assuming the device is motionless. These readings are averaged together to create a baseline reference value representing “normal stillness.” From that point onward, the system compares live acceleration data against this baseline rather than raw gravity values. This dramatically improves accuracy because the device now distinguishes between environmental stillness and actual vibration. This calibration system is a critical engineering step because it transforms the project from a raw-sensor demo into a contextualized measurement tool. The device is no longer just reading numbers; it is interpreting movement relative to known environmental conditions.
Once calibrated, the device calculates a “vibration score.” This is done by measuring the magnitude of total acceleration and comparing it to the baseline. The difference between the two values is treated as the current vibration intensity. That intensity is then converted into a percentage-based system ranging from 0–100. The scaling itself is intentionally exaggerated in this early version because the goal is not laboratory-grade precision yet, but rather meaningful visual responsiveness. The system is designed so that tapping the table, moving the shelf, or running a 3D printer nearby creates obvious, visible feedback. This gives the user immediate physical intuition about how much vibration is occurring in the environment.
Another major feature implemented is peak tracking. The system continuously monitors the highest vibration level detected since startup and stores it as the “peak.” This is particularly important because many mechanical systems, especially 3D printers, do not vibrate consistently. Instead, they produce short bursts of resonance during rapid travel moves, changes in acceleration, or aggressive infill patterns. A user may not notice a sudden spike in the live percentage display, but the peak tracker retains the highest event for later review. This transforms the device from a simple live monitor into a comparative analysis tool. Different printers, print speeds, infill types, enclosure setups, or shelf materials can now be tested and compared using measurable peak values.
From a broader engineering perspective, the project already demonstrates several important concepts simultaneously. It includes hardware communication protocols, embedded graphics rendering, sensor integration, calibration logic, real-time data processing, mathematical interpretation of physical movement, and UI feedback systems. Even the debugging process itself was valuable. Problems like missing library constants, incorrect color definitions, display initialization quirks, and baseline drift all had to be identified and corrected manually. This is the exact type of iterative troubleshooting that defines real-world electronics and embedded development.
Perhaps the most important part of the project is that the device already has practical value. This is not a random gadget built for the sake of building something. The Seismo V1 can genuinely help analyze the physical behavior of 3D printers and workspace setups. It can measure the amount of vibration transferred from a printer to a shelf, desk, or enclosure. It can compare machine stability across different printers. It can help identify resonance-heavy movement patterns. Eventually, it could even contribute to tuning, preventive maintenance, or print-quality optimization. The project has already moved from “interesting experiment” into “useful diagnostic instrument.”
What exists right now is Version 1 - the foundational layer. The next stages could introduce graph rendering, vibration history, FFT frequency analysis, Wi-Fi dashboards, Home Assistant integration, impact detection, logging systems, enclosure engineering, magnetic mounting systems, or even printer-specific vibration profiles. But the critical thing is that none of those future features matter unless the foundation works. And right now, the foundation does work. The device successfully senses the physical world, interprets movement, and presents that information visually in real time. That is the moment where a pile of components becomes an actual system.
Seismo V1: Mini Digital Seismograph